+1 619-349-4911


DevOps has changed the way organizations build, release, and manage software by improving collaboration between development and operations teams. It enables faster delivery, better quality, and more efficient workflows. However, adopting DevOps practices alone does not guarantee success. Without clear measurement, it becomes difficult to understand whether these improvements are actually delivering meaningful results.
Measuring DevOps success helps teams turn technical efforts into clear, measurable outcomes that stakeholders can understand. The right metrics and KPIs provide visibility into performance, highlight inefficiencies, and support continuous improvement. They also ensure that DevOps initiatives remain aligned with broader business goals.
The challenge?
Translating the dynamic, ever-evolving DevOps landscape into quantifiable success metrics that resonate with a diverse audience.
Now you’re acutely aware of the tangible improvements DevOps has brought about. But articulating these achievements in a way that resonates with stakeholders can feel like attempting to capture the wind in a net.
The solution?
Using the right metrics and KPIs that can be used to track DevOps success.
In this blog, we will dive deep into the key DevOps metrics and KPIs to track. Read on.
The Need for Measuring DevOps Success
Implementing DevOps is just the beginning; measuring its success is equally crucial. Some of the key reasons are outlined below:
- Continuous Improvement: You keep getting better by measuring DevOps success and finding areas to polish up your processes.
- Quality Enhancement: Let metrics be your guide to smoother software, fewer hiccups, and happier users.
- Speed and Efficiency: Metrics reveal how fast you’re going and how quickly you can bounce back – the DevOps way!
- Resource Optimization: Stop the resource guessing game – metrics show you where to put what for maximum efficiency.
- Alignment with Business Goals: Let metrics be your compass, making sure DevOps dances in sync with what the business wants.
- Risk Reduction: Spot trouble ahead with metrics, and dodge those pesky risks like a pro.
- Cultural Transformation: Share those metrics and watch your team turn into a collaboration powerhouse.
Suggested Reading: DevOps 101 – Your one-stop guide for all things DevOps.
Key Metrics and KPIs for Measuring DevOps Success
Amidst a plethora of metrics, we’ve distilled the essence down to the 10 metrics that truly make a difference. These metrics aren’t just numbers; they’re the guiding lights that lead your DevOps efforts toward enhanced efficiency, improved quality, and strategic alignment.
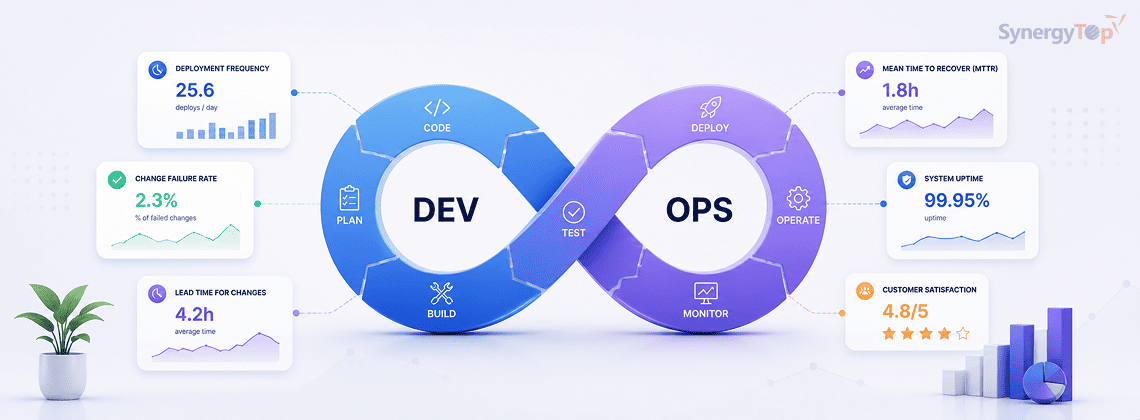
1. Deployment Frequency
- Measurement: Deployment frequency involves determining how frequently code is deployed to the production environment.
- Importance: This metric holds significant importance as it provides insights into the speed of your release cycle and the agility of your development process.
- Benchmarking: Compare your deployment frequency before and after implementing DevOps practices to assess improvements.

- How to measure: To measure deployment frequency, count the number of deployments that occur within a specific time period.
- Inferences: Frequent deployments indicate an efficient development and deployment process, resulting in quicker delivery of features and bug fixes.
2. Lead Time
- Measurement: Lead time refers to the duration taken from the moment code is committed to the point when it is successfully deployed in the production environment.
- Importance: This metric’s importance lies in reflecting the efficiency of your development pipeline and the time required to convert code changes into deliverable software.
- Benchmarking: By comparing lead times before and after the implementation of DevOps, as well as against industry peers, you can gauge improvements.
- Industry Standard: Although lead time standards vary across industries, shorter lead times are generally considered more favorable.
- How to measure: Calculate the time interval between the first code commit and the actual deployment.
- Inferences: Shorter lead times signify streamlined processes and improved collaboration between teams, contributing to faster software delivery.
3. Change Failure Rate
- Measurement: The change failure rate measures the percentage of deployments that result in incidents or issues.
- Importance: This metric is crucial in demonstrating the stability of your deployment process and the effectiveness of testing and quality assurance practices.
- Benchmarking: To continually improve, it’s recommended to compare your change failure rate against industry standards.
- Industry Standard: While industry standards vary, lower change failure rates are preferred.
- How to measure: Calculate the change failure rate by dividing the number of failed deployments by the total number of deployments.
- Inferences: Lower change failure rates indicate robust testing practices and higher-quality deployments.
4. Mean Time to Recovery (MTTR)
- Measurement: MTTR measures the average time taken to resolve incidents or issues once they occur.
- Importance: This metric reflects your incident response efficiency and the impact incidents have on user experience.
- Benchmarking: By comparing MTTR before and after the adoption of DevOps practices, you can assess improvements.
- Industry Standard: The acceptable MTTR varies based on incident severity, but shorter times are generally more favorable.
- How to measure: Calculate the average time it takes to resolve incidents.
- Inferences: A lower MTTR signifies efficient incident management, leading to minimal disruptions and enhanced user satisfaction.
5. Availability and Uptime
- Measurement: Availability and uptime measure the percentage of time your application remains functional and accessible.
- Importance: These metrics reflect the reliability of your application and directly impact user experience.
- Benchmarking: Comparing your application’s uptime against industry standards and historical data helps gauge its performance.
- Industry Standard: High availability, ideally 99.99% or more, is considered a standard to strive for.
- How to measure: Calculate the ratio of uptime to the total time.
- Inferences: Higher uptime percentages are indicative of better reliability and increased user trust.
6. Automated vs. Manual Testing Ratio
- Measurement: This metric involves calculating the proportion of automated tests within your overall testing process.
- Importance: The ratio reflects the level of test automation, which influences testing efficiency and the speed of software releases.
- Benchmarking: It’s advisable to compare your automated vs. manual testing ratio with industry best practices for your niche.
- Industry Standard: While the standard varies, higher ratios generally lead to more efficient testing.
- How to measure: Calculate the ratio by dividing the number of automated tests by the total number of tests.
- Inferences: A higher ratio suggests a more efficient testing process and quicker feedback loops.

7. Deployment Success Rate
- Measurement: The deployment success rate measures the percentage of deployments that are successful and error-free.
- Importance: This metric reflects the reliability of your deployment process and the quality of your code.
- Benchmarking: Regularly comparing your deployment success rate over time and against industry averages helps in identifying trends.
- Industry Standard: Although aiming for close to 100% is ideal, acceptable standards may vary.
- How to measure: Calculate the ratio of successful deployments to total deployments.
- Inferences: Higher deployment success rates indicate effective deployment processes and thoroughly tested code.
8. Infrastructure as Code (IaC) Coverage
- Measurement: This metric involves calculating the percentage of your infrastructure that is managed using code.
- Importance: The metric reflects the extent of automation in provisioning and managing your infrastructure.
- Benchmarking: Comparing your IaC coverage against industry trends and best practices helps assess your automation level.
- Industry Standard: While standards vary, higher IaC coverage is generally advantageous.
- How to measure: Calculate the ratio of IaC-managed infrastructure to the total infrastructure.
- Inferences: Higher IaC coverage indicates efficient, scalable, and easily reproducible infrastructure.
9. Code Churn
- Measurement: Code churn measures the frequency of code changes within a specific time frame.
- Importance: The metric reflects the stability of your codebase and the potential for introducing defects.
- Benchmarking: By comparing code churn before and after adopting DevOps practices, you can gauge the impact on stability.
- Industry Standard: While context matters, lower code churn is generally preferred.
- How to measure: Count the number of code changes that occur within a specific period.
- Inferences: High code churn may lead to instability and an increased risk of bugs, while reduced churn suggests a more stable codebase.
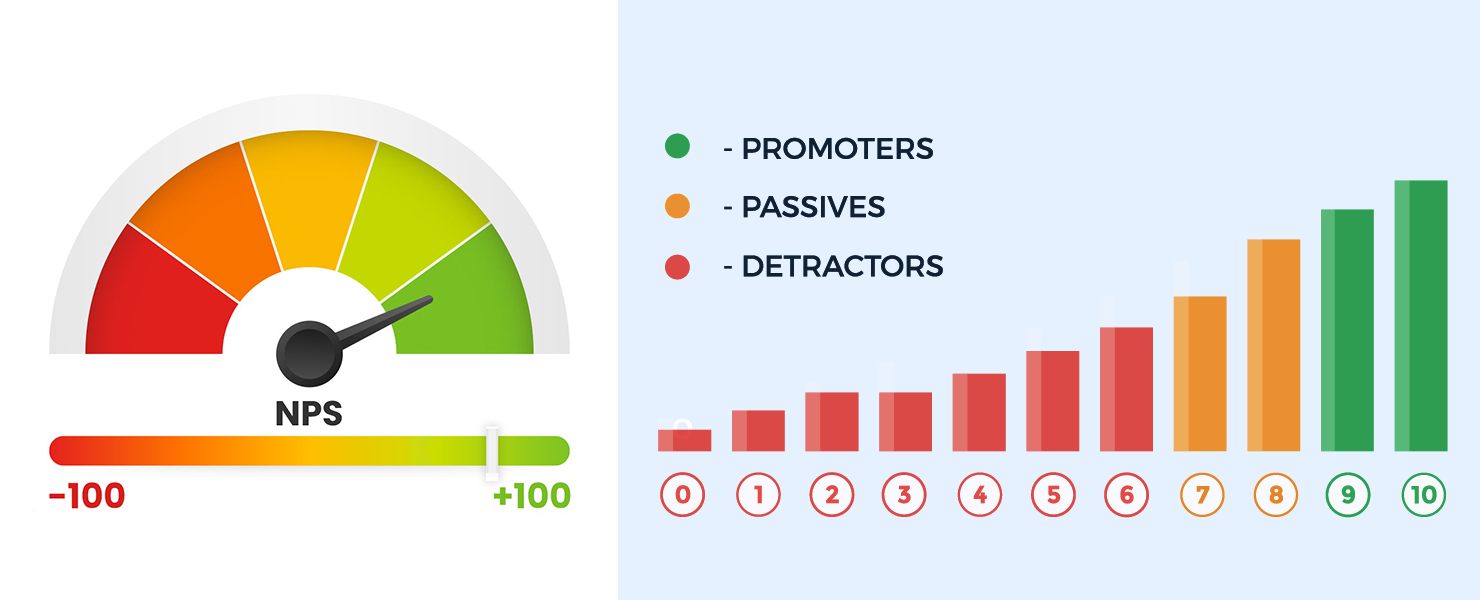
10. Customer/User Satisfaction
- Measurement: This metric involves measuring user satisfaction through surveys, feedback, or ratings.
- Importance: User satisfaction reflects the impact of your software on users and the overall success of your DevOps efforts.
- Benchmarking: Regularly comparing user satisfaction scores over time and against industry benchmarks helps assess your software’s performance.
- Industry Standard: User satisfaction standards vary across industries and companies, with higher scores indicating success.
- How to measure: Gather user feedback through surveys, feedback forms, or ratings.
- Inferences: Higher user satisfaction scores are indicative of successful DevOps practices that contribute to positive user experiences.
Key to DevOps Success: Working With Experts
Now you know the key metrics and KPIs that you should track to measure and monitor DevOps success.
However, there’s one thing more important than that – Collaborating with DevOps implementation experts.
Why? Because these experts have the experience and knowledge to:
- Identify Relevant Metrics
- They will understand your specific context and can help you select metrics aligned with your goals and challenges.
- Implement Effective Measurement:
- Experts can guide the proper implementation of tools and processes to accurately measure metrics and KPIs.
- Monitor and Analyze:
- These experts can continuously monitor metrics, analyze trends, and provide actionable insights for process enhancement.
- Understand and Improve:
- They interpret metric data to uncover bottlenecks and areas for improvement, driving meaningful changes in your DevOps practices.
By partnering with DevOps experts, you gain a competitive edge by leveraging their expertise to fine-tune your DevOps processes. This leads to improved software delivery, enhanced collaboration, and better overall business outcomes.